Nick Nonnenmacher's Portfolio
Collection of Open Source GIS project work during Spring 2021
A Classification of Natural Rivers
RE- Replication of Rosgen Stream Classification
Original study by Rosgen, D. L. in CATENA 22 (3):169–199. https://linkinghub.elsevier.com/retrieve/pii/0341816294900019.
and Replication by: Kasprak, A., N. Hough-Snee, T. Beechie, N. Bouwes, G. Brierley, R. Camp, K. Fryirs, H. Imaki, M. Jensen, G. O’Brien, D. Rosgen, and J. Wheaton. 2016. The Blurred Line between Form and Process: A Comparison of Stream Channel Classification Frameworks ed. J. A. Jones. PLOS ONE 11 (3):e0150293. https://dx.plos.org/10.1371/journal.pone.0150293.
Replication Authors: Nick Nonnenmacher, Zach Hilgendorf, Joseph Holler, and Peter Kedron.
Replication Materials Available at: nicknonnen/RE-rosgen
Created 21 March 2021
Revised 28 March 2021
Introduction and Motivation
Understanding river dynamics and morphology is crucial to further understanding how a system influences and interacts with surrounding environments. Through a classification system such as the Rosgen Classification of Natural Rivers, these dynamics can be better studied and researchers can more accurately and effectively predict, manage, and conserve environments within and adjacent to river systems.
This report stems from the original 1994 study A classification of natural rivers by Rosgen, which established a classification hierarchy with 7 major categories from A to G. Rosgen’s motivation for this system was to aid river restoration, engineering, and conservation, as well as help predict oft-erratic future behavior with higher accuracy. That study was then replicated by Kasprack et al in 2016, in the report The blurred line between form and process: A comparison of stream channel classification frameworks. In this replication, Kasprack aimed to identify weaknesses in four different river classification models (Rosgen, the River Styles Framework, the Natural Channels Classification, and Channel-form Based Statistical Classifications) in the same place - the John Day Watershed in eastern Oregon. Kasprack concluded the four schemes were largely consistent.
This study is a replication of Kasprack’s analysis, with the goal of reproducing results using Rosgen’s classification scheme, open-source GIS software, and the same data sets, to test to what extent such a river classification study is possible without any field aspect, and without oversimplifying our conclusions.
Procedure and Data
Data
Procedure
The purpose of this study was to replicate Kasprak’s analysis to determine if the methodology was reproducible and viable. Therefore, the procedure for this project follows exactly or very closely that of Kasprak’s, and focuses on study sites within the John Day Watershed. This replication effort was distributed across all students in Joe Holler’s spring 2021 GEOG 323 Open Source GIScience, and the analysis in this document focuses specifically on study site 25 (loc_id = 25).
All procedures, code, and material for this study can be found here, in my individual RE-Rosgen repository.
Detailed procedures for the GRASS analysis may be found here. The code for R Studio analysis may be found here.
First, a GIS analysis of the data was conducted in GRASS. Models were used for visualizing data in GRASS and calculating centerlines of rivers at each study site, eliminating steps in section 1.3 and 2.2 respectively.
Next, a cross-sectional graph, longitudinal profile, and flood-prone width profile were constructed in R Studio, following this R markdown document. From these results, Tables 1, 2, and 3 were populated, and Rosgen Level I and Level II classifications were determined (see Tables in the Results and Discussion section).
Some deviations from Kasprak’s methodology were observed during this study. Beyond using the models noted above to replace sections of workflow, slope as seen in Table 3 was recalculated. While the R Markdown file code calculated slope between every 1-meter point and then averaged that value, this study defined slope as the difference in elevation over the length of the river segment contained within the location buffer.
This assessment will be deemed successful if, based on the analysis conducted and measurement calculated, the same Rosgen classification code is applied to this river system segment as in Kasprak’s study.
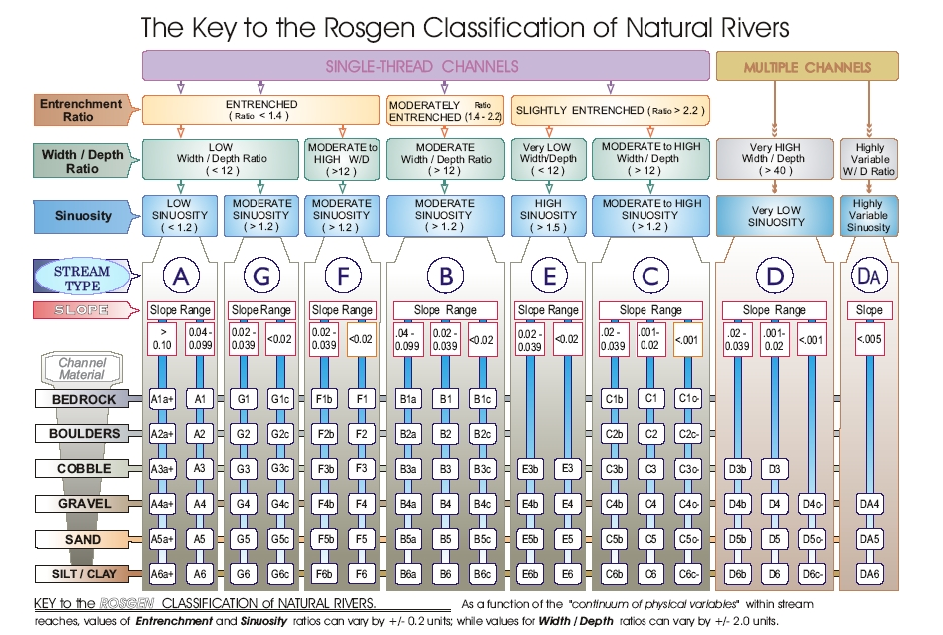 Figure 1.
Replication Results
Through utilization of GRASS, RStudio, and QGIS software, we were able to nearly completely replicate Kasprak’s study.
The results of this study include basic calculations of the site river’s characteristics in Table 1, consisting of bankfull width and depth, valley width and depth, river length and particle diameter; calculations to determine the site river’s Rosgen Level I classification in Table 2, consisting of entrenchment ratio, width : depth ratio, and sinuosity; and calculations to determine the site river’s Rosgen Level II classification in Table 3, consisting of slope and channel material. Sources for Table 1 values are listed within the table. In Table 2, entrenchment ratio was calculated by dividing the estimated flood-prone width (determined by the Cross-Sectional Profile in Figure 6) by the average bankfull width. Width : depth ratio was calculated by dividing the average bankfull width by the average bankfull depth. Slope was calculated by dividing the change in elevation within the study site by the length of the river within the study site.
The figures below were produced from 1m-resolution data. The final Rosgen Level II classification of this river was determined to be C4, which differed to Kasprak’s C4b. The main difference between these two classifications is slope, as seen in Figure 1 above. The river still displays the underlying common properties of a single-thread, slightly entrenched river with moderate sinuosity, characteristic of a meandering channel.
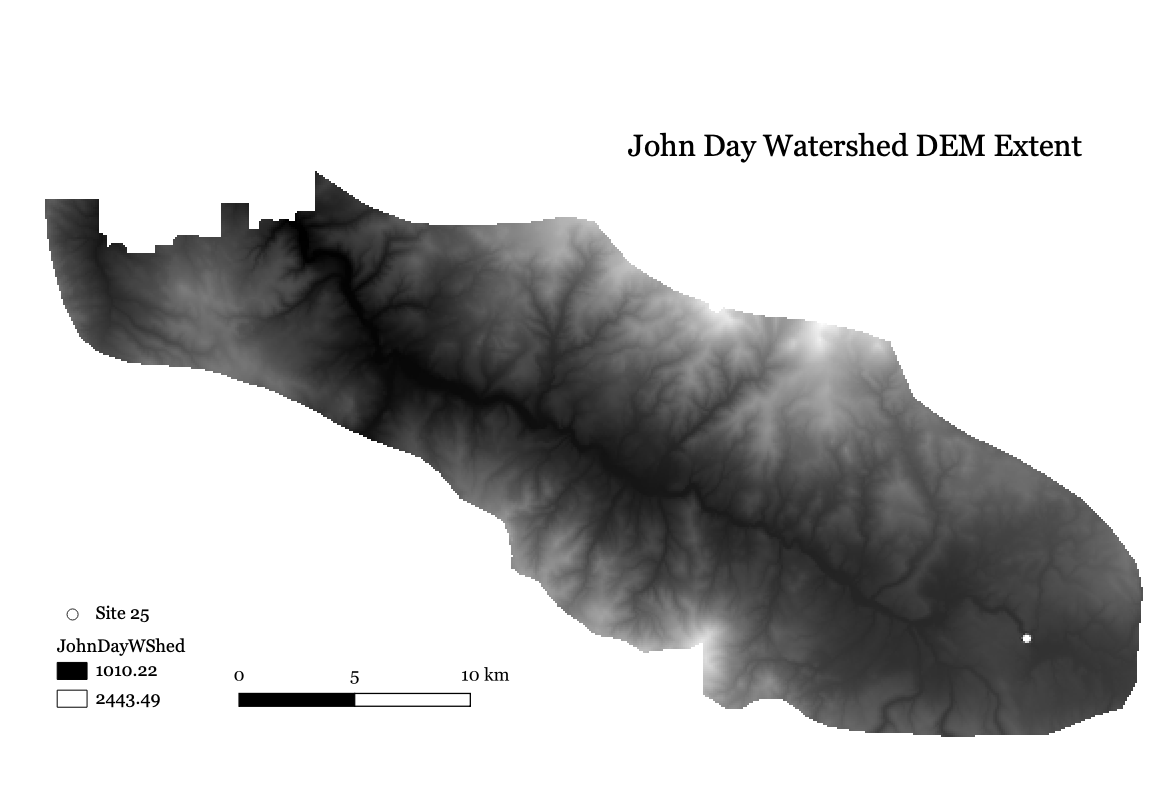 Figure 2. DEM map of the John Day Watershed extent, with Study Site 25 highlighted in the southeastern region.
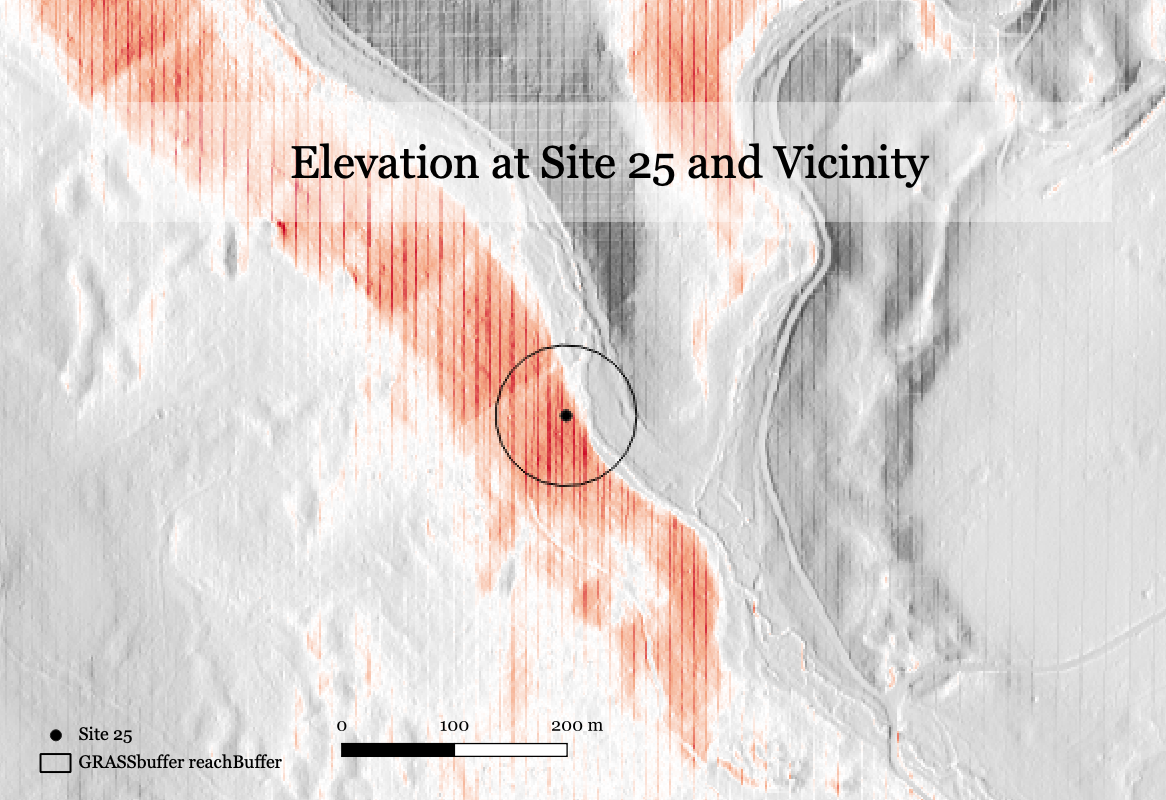 Figure 3. Visualizing elevation at Site 25. Red regions correlate to ground that is higher above sea level.
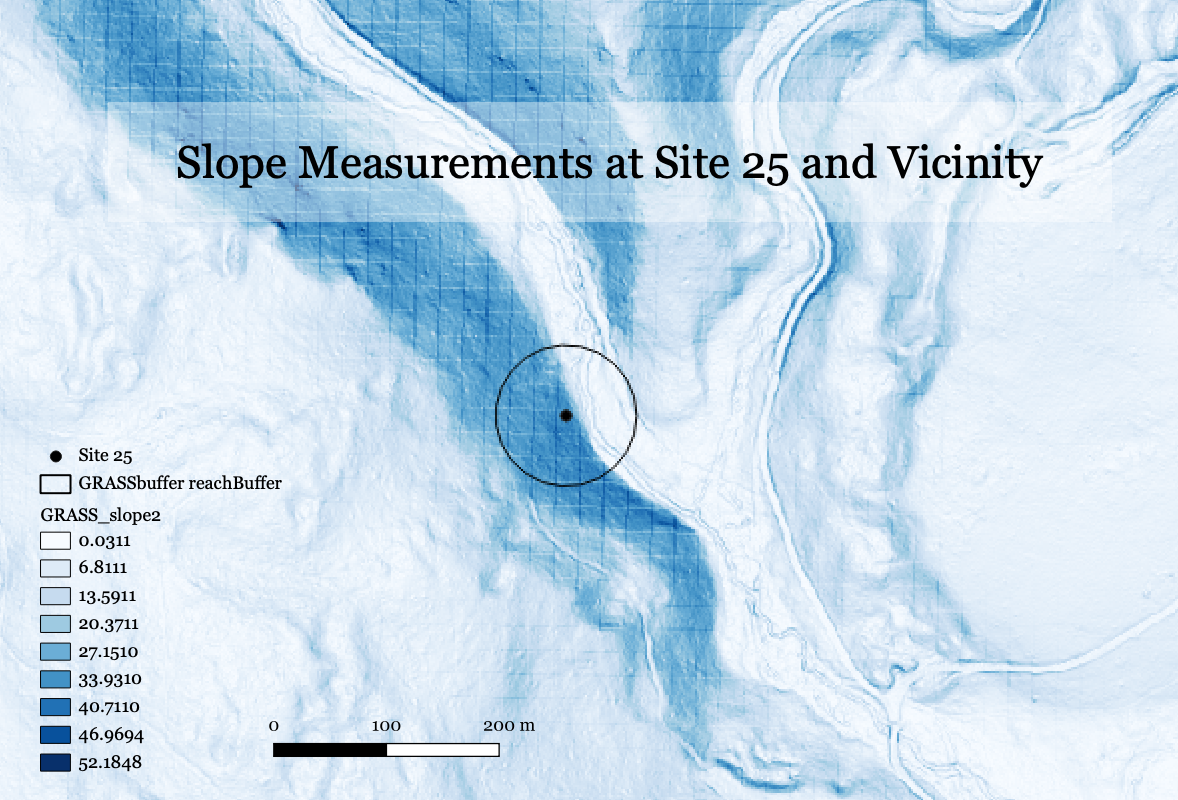 Figure 4. Visualizing slope at Site 25. Bluer regions correlate to steeper slopes.
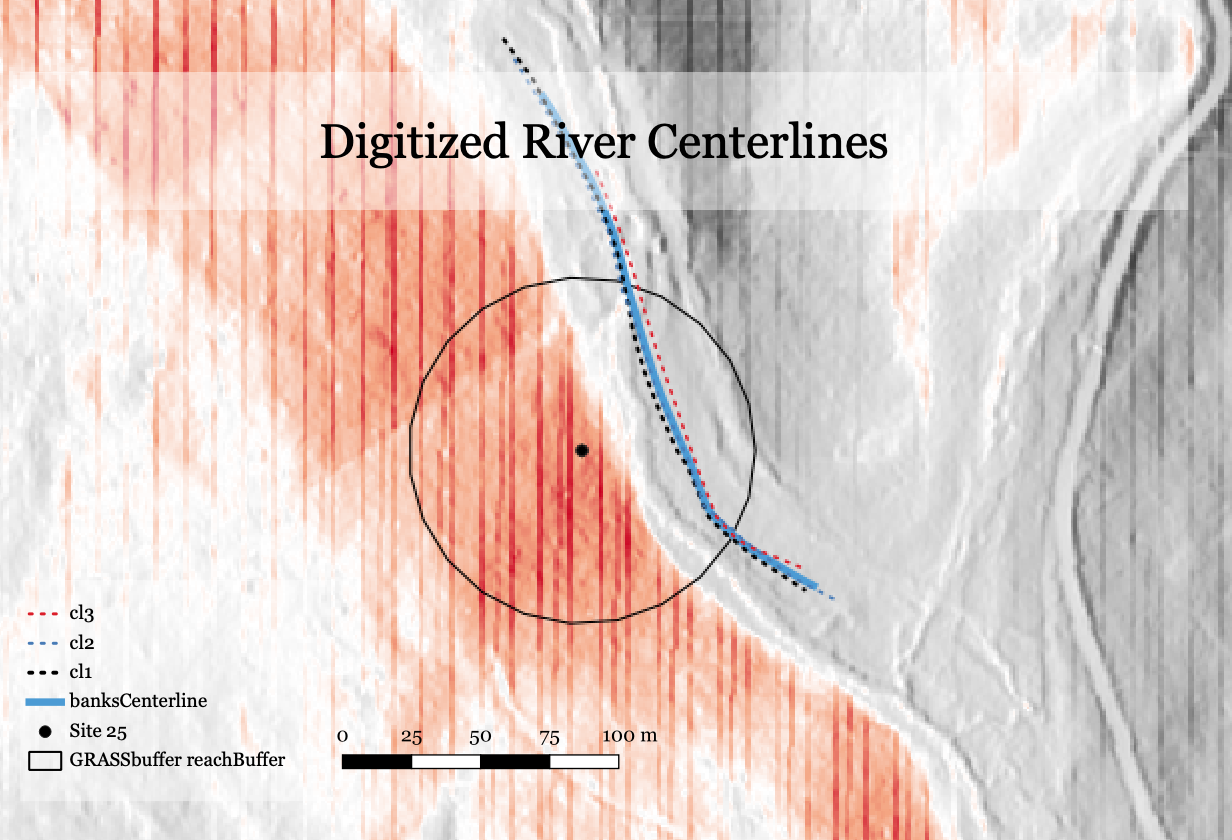 Figure 5. Visualizing the digitization process of determining the centerline of the river running through Site 25. In order to calculate sinuosity and determine the Rosgen Level I class of a river, its centerline must be measured. This process was repeated for the valley banks on either side, and the two average centerlines were compared to calculate sinuosity (see Table 2).
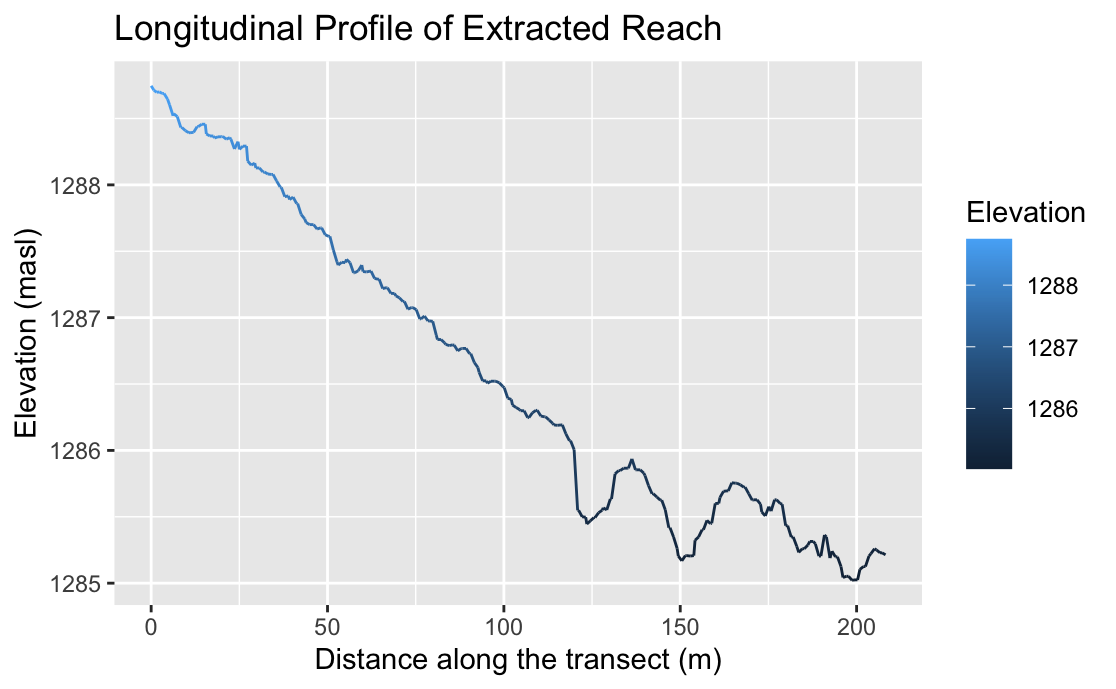 Figure 6. The longitudinal profile of the river within Site 25. Note the different scales of the x and y axes. The peaks and valleys in the bottom righthand side of the graph are due to human error while digitizing valley and river centerlines, and accidentally including portions of the valley side.
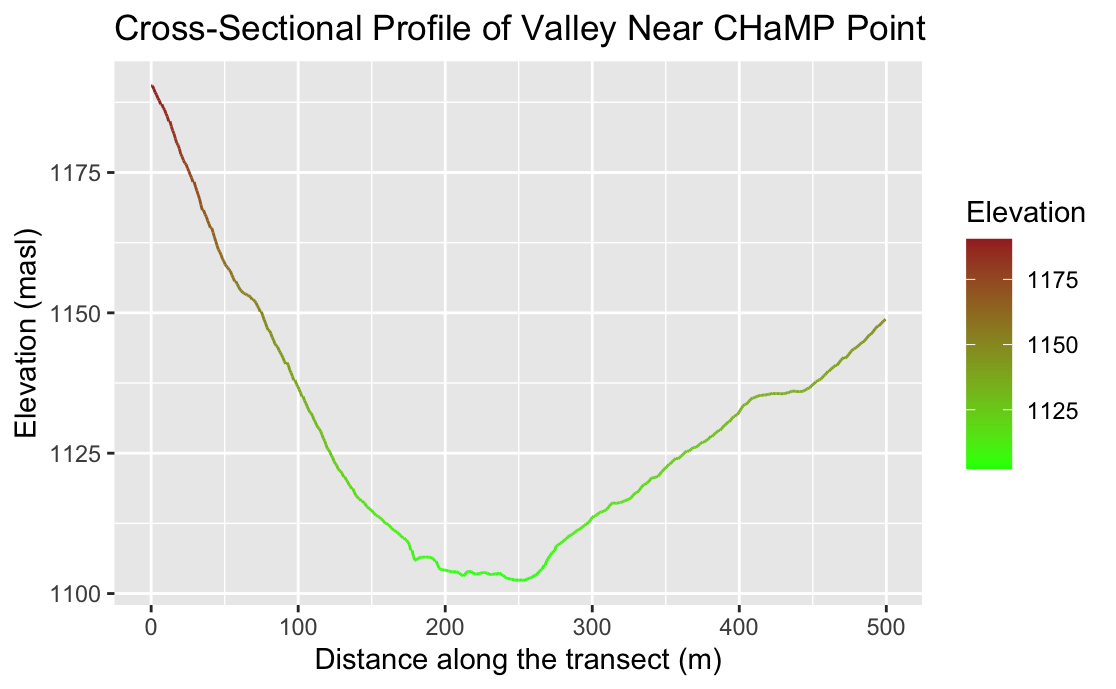 Figure 7. The cross-sectional profile of the river within Site 25. Note the different scales of the x and y axes. The bankfull width and flood-prone width may be estimated based off the center trough of this graph.
Table 1. Site Measurements
| Variable | Value | Source |
|---|---|---|
| Bankfull Avg Width | 4.637 | CHaMP Data |
| Bankfull Avg Depth | 0.238 | CHaMP Data |
| Bankfull Max Depth | 0.627 | CHaMP Data |
| Valley Width | 85 | Terrain Cross-Section in R |
| Valley Depth | 3 | Terrain Cross-Section |
| Stream/River Length | 208.993 | CHaMP Data |
| Valley Length | 197.033 | Derived |
| Median Channel Material Particle Diameter | 59 | Derived |
Table 2. Rosgen Level I Classification
| Criteria | Value |
|---|---|
| Entrenchment Ratio | 18.331 |
| Width / Depth Ratio | 19.483 |
| Sinuosity | 1.061 |
| Level I Stream Type | C |
Table 3. Rosgen Level II Classification
| Criteria | Value |
|---|---|
| Slope | 0.0167 |
| Channel Material | Gravel |
| Level II Stream Type | C4 |
Unplanned Deviations from the Protocol
In order to initially install the required add-ons in GRASS on MacOS, XCode Command Line Tools had to be installed from the Apple Developers Library. More information on this issue and how to overcome may be found here. In addition, in order to open certain data it was necessary to install The Unarchiver application. Finally, as mentioned in the Procedure and Data section above, slope was recalculated as the difference in elevation over length of the river contained in the loc_id = 25 study site.
Discussion
This analysis concludes the river segment loc_id = 25 in the John Day watershed falls under the Rosgen Level I classification c, and Level II classification C4. This differs from Kasprak’s Level II classification of C4b, which means the recalculation of slope in this study did have a significant effect on the end conclusion. Otherwise, however, Kasprak’s calculations were largely accurate and reproducible via remote GIS efforts demonstrated here.
The Level I and II results found through these analyses are internally and logically consistent. As can be seen in the maps above, Study site 25 is located just before a fork in the river and covers a relatively straight and flat portion. The valley encompassed within the buffer zone (while not including much of the far shore) was easily determined, which greatly aided digitization and calculation. Determining the path of channels was slightly more difficult, but nevertheless possible. The same cannot be said of other Study Sites analyzed by GEOG 323 classmates, and this confusion proved to be one of the most significant barriers to accurately completing remote river classification work.
Conclusion
This virtual replication of Kasprak’s The blurred line between form and process: A comparison of stream channel classification frameworks demonstrates that while a significant amount of stream classification work can be completed using GIS tools alone, some field work is necessary to collect valid and accurate data and make informed conclusions. This study sought to reproduce Kasprak’s work using the same preexisting datasets and workflows, and would be deemed successful if the same Level I and II Rosgen stream classifications were reached after analysis. Only the Level I classification agreed between the two studies, reaffirming that in-person research at the site may have contributed to a more accurate final result.
This conclusion comes with the interesting implication that perhaps stream classification work could be effectively done remotely in the future for other river systems. This conclusion must be accompanied by a cautious warning, however, as this study piggybacked off of a robust dataset and was, from the beginning, a replication of a study that had already produced results - nothing new was going to come of this work. This does not mean the remote replication was less work, and certainly required just as much critical thinking and analysis as Kasprak’s field study. There is also the issue of how remote stream classification work may contribute to budding Open Science platforms and practices, as there is a significant barrier to entry in completing remote GIS work due to the amount of software necessary to learn. This study was completed by students studying the software, not the rivers, and therefore is not rooted in strong understandings (for the most part) of river dynamics and classification systems. It can be expected that the researchers most interested in the imlications of this work would have stronger backgrounds in river systems and less understanding of the software, and could therefore face significant hurdles in accurately and efficiently replicating such a study with another dataset. Nevertheless, with a greater volume of Open Science students will come a greater volume of Open Science practice, and the future will surely bring a group of motivated and capable researchers back to these studies again, to unlock yet more potential for river systems studies and open source GIS alike.
References
Kasprak, A., N. Hough-Snee, T. Beechie, N. Bouwes, G. Brierley, R. Camp, K. Fryirs, H. Imaki, M. Jensen, G. O’Brien, D. Rosgen, and J. Wheaton. 2016. The blurred line between form and process: A comparison of stream channel classification frameworks ed. J. A. Jones. PLOS ONE 11 (3):e0150293. https://dx.plos.org/10.1371/journal.pone.0150293.
Rosgen, D. L. 1994. A classification of natural rivers. CATENA 22 (3):169–199. https://linkinghub.elsevier.com/retrieve/pii/0341816294900019.
Report Template References & License
This template was developed by Peter Kedron and Joseph Holler with funding support from HEGS-2049837. This template is an adaptation of the ReScience Article Template Developed by N.P Rougier, released under a GPL version 3 license and available here: https://github.com/ReScience/template. Copyright © Nicolas Rougier and coauthors. It also draws inspiration from the pre-registration protocol of the Open Science Framework and the replication studies of Camerer et al. (2016, 2018). See https://osf.io/pfdyw/ and https://osf.io/bzm54/
Camerer, C. F., A. Dreber, E. Forsell, T.-H. Ho, J. Huber, M. Johannesson, M. Kirchler, J. Almenberg, A. Altmejd, T. Chan, E. Heikensten, F. Holzmeister, T. Imai, S. Isaksson, G. Nave, T. Pfeiffer, M. Razen, and H. Wu. 2016. Evaluating replicability of laboratory experiments in economics. Science 351 (6280):1433–1436. https://www.sciencemag.org/lookup/doi/10.1126/science.aaf0918.
Camerer, C. F., A. Dreber, F. Holzmeister, T.-H. Ho, J. Huber, M. Johannesson, M. Kirchler, G. Nave, B. A. Nosek, T. Pfeiffer, A. Altmejd, N. Buttrick, T. Chan, Y. Chen, E. Forsell, A. Gampa, E. Heikensten, L. Hummer, T. Imai, S. Isaksson, D. Manfredi, J. Rose, E.-J. Wagenmakers, and H. Wu. 2018. Evaluating the replicability of social science experiments in Nature and Science between 2010 and 2015. Nature Human Behaviour 2 (9):637–644. http://www.nature.com/articles/s41562-018-0399-z.