Nick Nonnenmacher's Portfolio
Collection of Open Source GIS project work during Spring 2021
RP - Kang et al. reproduction
Report outline
Introduction explaining the interest and purpose in reproducing the Kang et al (2020) study, and very briefly introducing what the study was about.
Introduction
As the COVID-19 pandemic spread across the world, the first step to containing it was understanding where it was and how it spread. An efficient and effective way to accomplish this is through big datasets manipulated and analyzed by modern coding languages such as Python, and using open source data platforms such as OSM. In 2020, Kang et al. conducted a study to measure and visualize the spatial accessibility of COVID-19 healthcare resources, with a focus on the state of Illinois. This reproduction focuses further on the city of Chicago and surrounding areas.
Beyond the study’s timeliness with regards to the pandemic it studied, Kang et al. (2020) was groundbreaking in another sense as well: much of the code used to collect and analyze this data was published in an accessible Jupyter notebook, allowing our class to closely study the methods and results in the context of learning how to conduct open source geospatial science. In this reproduction, I closely examined the code used by Kang et al. (2020) in an effort to validate and improve the methods and conclusions.
The code and final products of this reproduction may be found in this GitHub repository: nicknonnen/RP-Kang.
Materials and Methods
Materials and Methods briefly explaining and citing what data sources and computational resources were used for the study. Explain any changes you made to the original python notebook / repository.
Data for this study was collected from three unique sources.
- Network data was collected from OpenStreetMap
- this was then analyzed through the Python library OSMNX
- Population data was collected from the American Community Survey (ACS)
- Hospital data was collected from Homeland Infrastructure Foundation-Level Data (HIFLD)
This analysis was carried out in Python, and may be found in its entirety in this Jupyter notebook.
The main analytical component of the study was creating an enhanced tow-step floating catchment area for each hospital, in order to determine which spaces had the highest accessibility to COVID-19 helathcare resources.
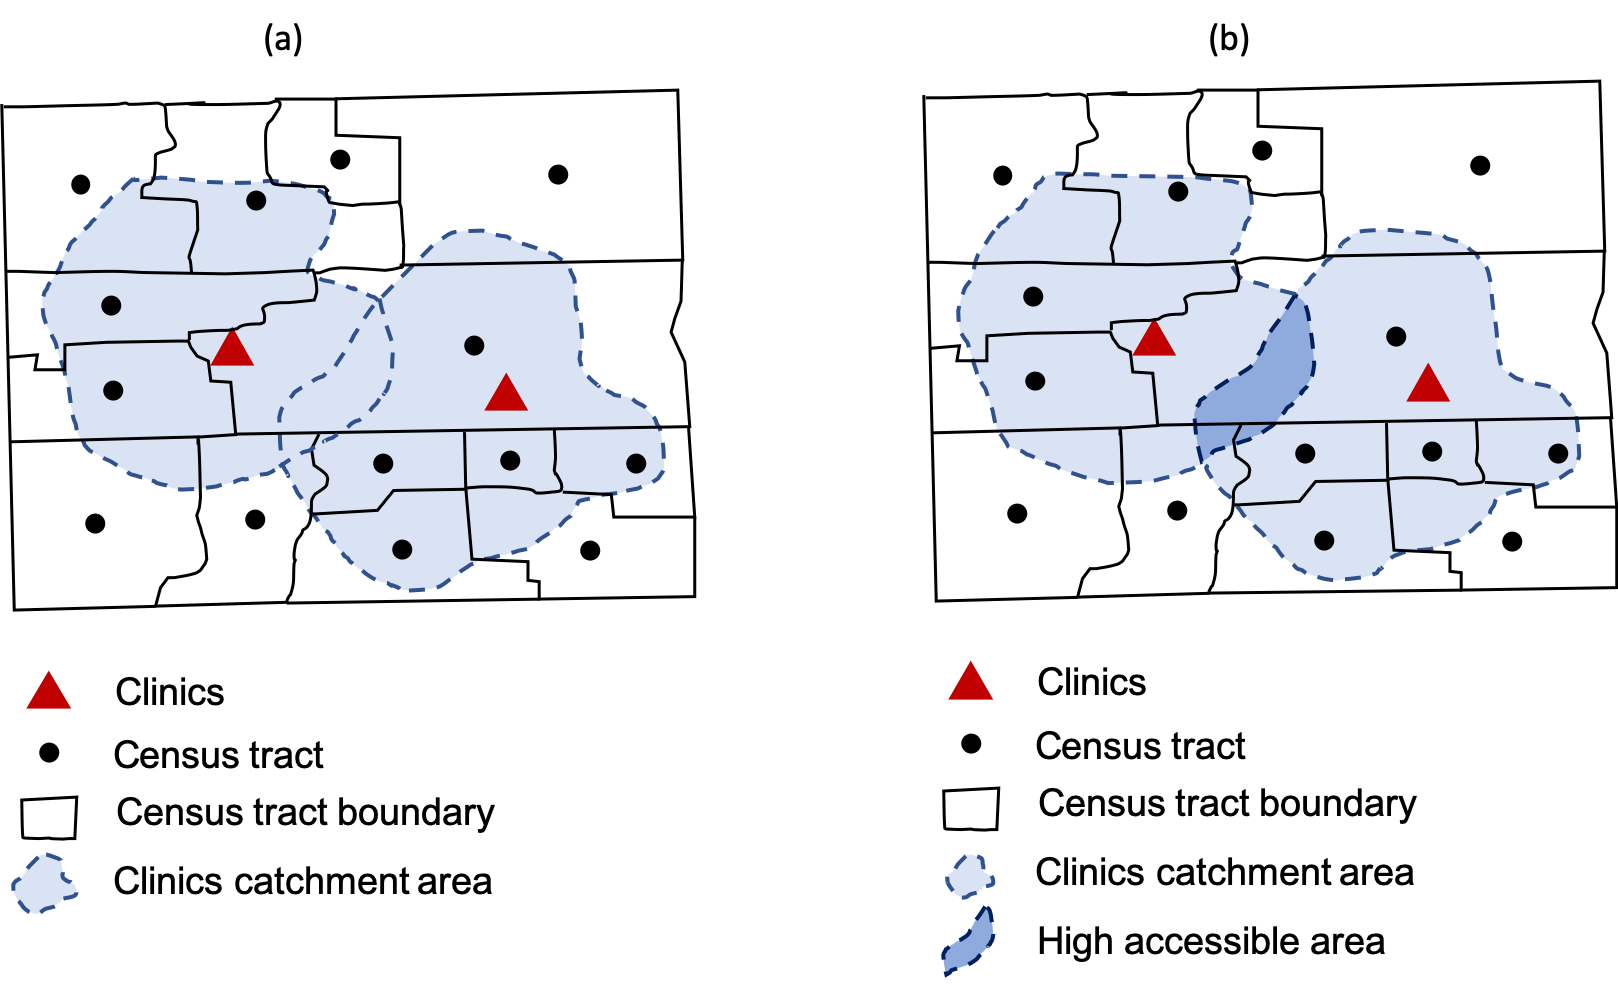 Figure 1. Visualizing an enhanced two-step floating catchment area (Figure 3 in Kang et al. (2020)).
The first step was cleaning the network data. The only error of note in the workflow of the original study was observed in this step, so the only significant change in the methodology of Kang et al. may be found in this step. This code is contained in the ‘Load and Plot Street Network’ section of the ‘Load and Visualize Data’ chapter of the notebook, and serves to pull street network data from OSM to use in the distance matrix aspect of creating catchment areas. In the original study, hospitals all over Illinois were being studied, but in this reproduction, only hospitals in and around Chicago were studied. In order to ensure the actual healthcare capabilities of those adjacent hospitals were being accurately represented for the population of Chicago, it was necessary to add a buffer zone around OSM’s geospatial definition of Chicago, of 30km. This buffer zone was not included in the original study because it was not necessary at that scale.
Once the street network had been properly cleaned and processed, the actual analysis could begin. This began by creating the enhanced two-step floating catchment area model, inputting the collected data, and summarizing by resource availability at each hospital. The final step was to visualize this in a simple map, seen below in Figure 2.
One additional minor change was made to each of the analysis and visualization functions, namely to add a timestamp indicator to better determine the efficiency of each function. This is a very small change and aims to improve the efficiency of the study overall by highlighting the slower functions and bringing them attention and effort to edit and improve.
Results and Discussion
Spatial access to COVID-19 healthcare resources in and around Chicago, IL may be seen in Figure 2. The darker red areas indicate higher access to healthcare resources, and the lighter regions indicate increased distance from hospitals and subsequent ICU beds and ventilator resources. The original Kang et al. (2020) study was able to analyze these findings in significantly greater depth, but this reproduction effort still shines a light on the disparities in access to healthcare, even during a global pandemic, and concurrently validates the findings of Kang et al. using a similar workflow and identical datasets.
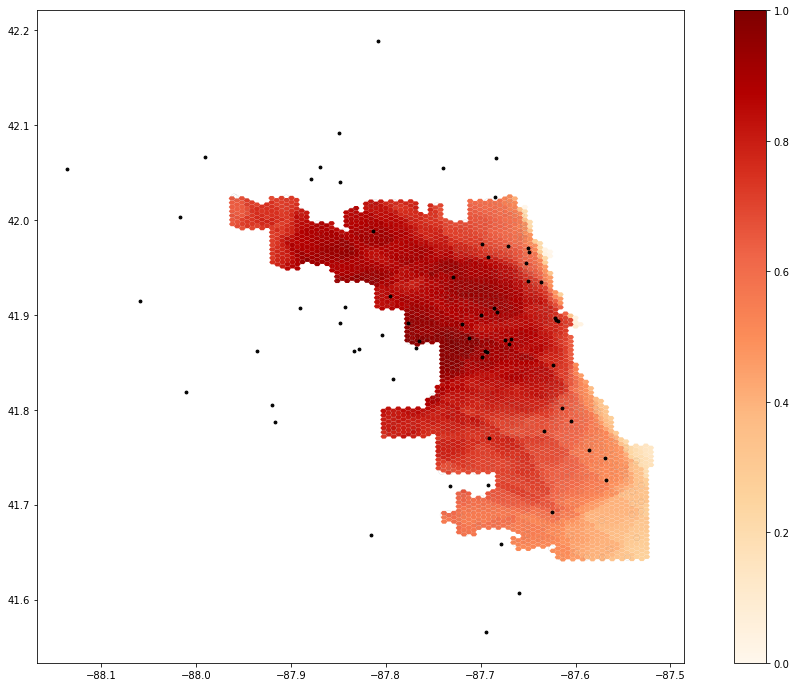 Figure 2. Spatial access to healthcare resources in and around Chicago.
I learned a great deal from completing this reproduction. The most important insight is the necessity for constant revisions to code and workflow, especially when a major aspect of the study has changed (such as scale, or the release of new software or code libraries). Revisions are always crucial, and publishing code in an open and accessible manner such as a Jupyter notebook is one of the best ways to ensure this. This study also highlighted the importance of including contributors from different backgrounds and with different primary mindsets - the authors of Kang et al. are incredibly competent at computational thinking and analysis, but often did not use the most efficient geospatial thinking in their workflow. The introduction of Professor Holler and our class brought an element of geospatial thinking that was able to provide useful edits and improve the study as a whole, in turn directly improving the state of Illinois’ understanding of how a deadly disease moves through their state.
Conclusions
In conclusion, this reproduction of Kang et al. (2020) was successful and returned results to validate those produced by the original study. There is evident variation in the accessibility to COVID-19 healthcare resources in and around the city of Chicago, and likely has significant effects on the ability of some residents to survive this global pandemic.
This study is reproducible and replicable, but this specific reproduction study has highlighted the importance of keeping scale in mind when pulling data as instructed by the original study. Additionally, this study has shown how effective Jupyter notebooks can be in increasing transparency and reproducibility of geospatial studies such as this. This study does a very good job of conducting open science, and its format should be used as an example for every future scientific endeavor that seeks to employ Python or other languages in its analysis. As more and more studies, relating to geography and beyond, rely on coding and forms of computational thinking, Jupyter notebooks will become more and more useful for maintaining accessibility and ensuring valid science is being done in the world.