Nick Nonnenmacher's Portfolio
Collection of Open Source GIS project work during Spring 2021
Gravity Model Spatial Interaction
Updated 05/25/2021
Background and Introduction
For this assignment, I created a Gravity Model of Spatial Interaction to illustrate the potential interactions between two places.
In this lab, I’m using a model to determine the service area “catchment” areas for hospitals in the Northeast US. The model uses three variables to calculate potential interaction: the “weight” of the input, the “weight” of the target, and the distance between the input and the target. The potential for interaction is based on values of the weights multiplied together and the divided by the distance, to produce the equation
((InputWeight)^λ * (TargetWeight)^α) / (Distance)^β
All three exponent parameters, λ, α, and β, are modifiable by the user of the model. The β parameter is set to a default value of 2, due to the more significant influence distance has on the interaction of two points in space, while parameters λ and α are set to a default value of 1.
Methods and Results
Data Sources:
- Population data by Joe Holler
- Hospital Data: Homeland Security
- Dartmouth Atlas of Health Care boundary files
In this exercise, I analyzed the interactions of towns and hospital clusters in the Northeast US and then compared those catchment areas to the those of the Dartmouth Health Atlas. The aggregated results may be found in this interactive Leaflet map.
Here is the preprocessing model used to clean hospital data. This model is available for download here.
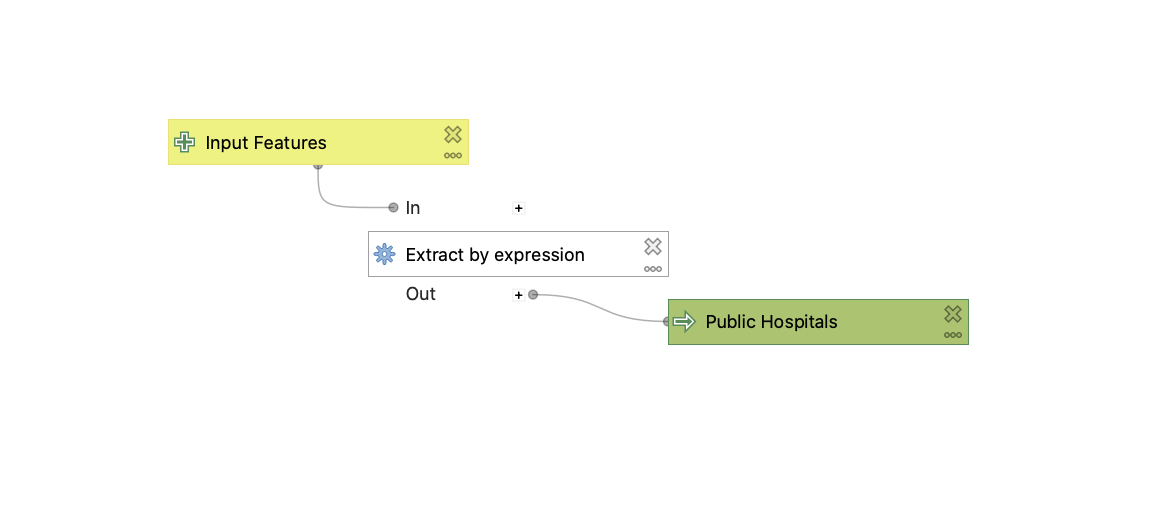 Figure 1. To clean and prepare hospital data, all private and specialized hospitals were removed from the data pool.
Here is the completed gravity model used to create HSAs. The file is available for download here.
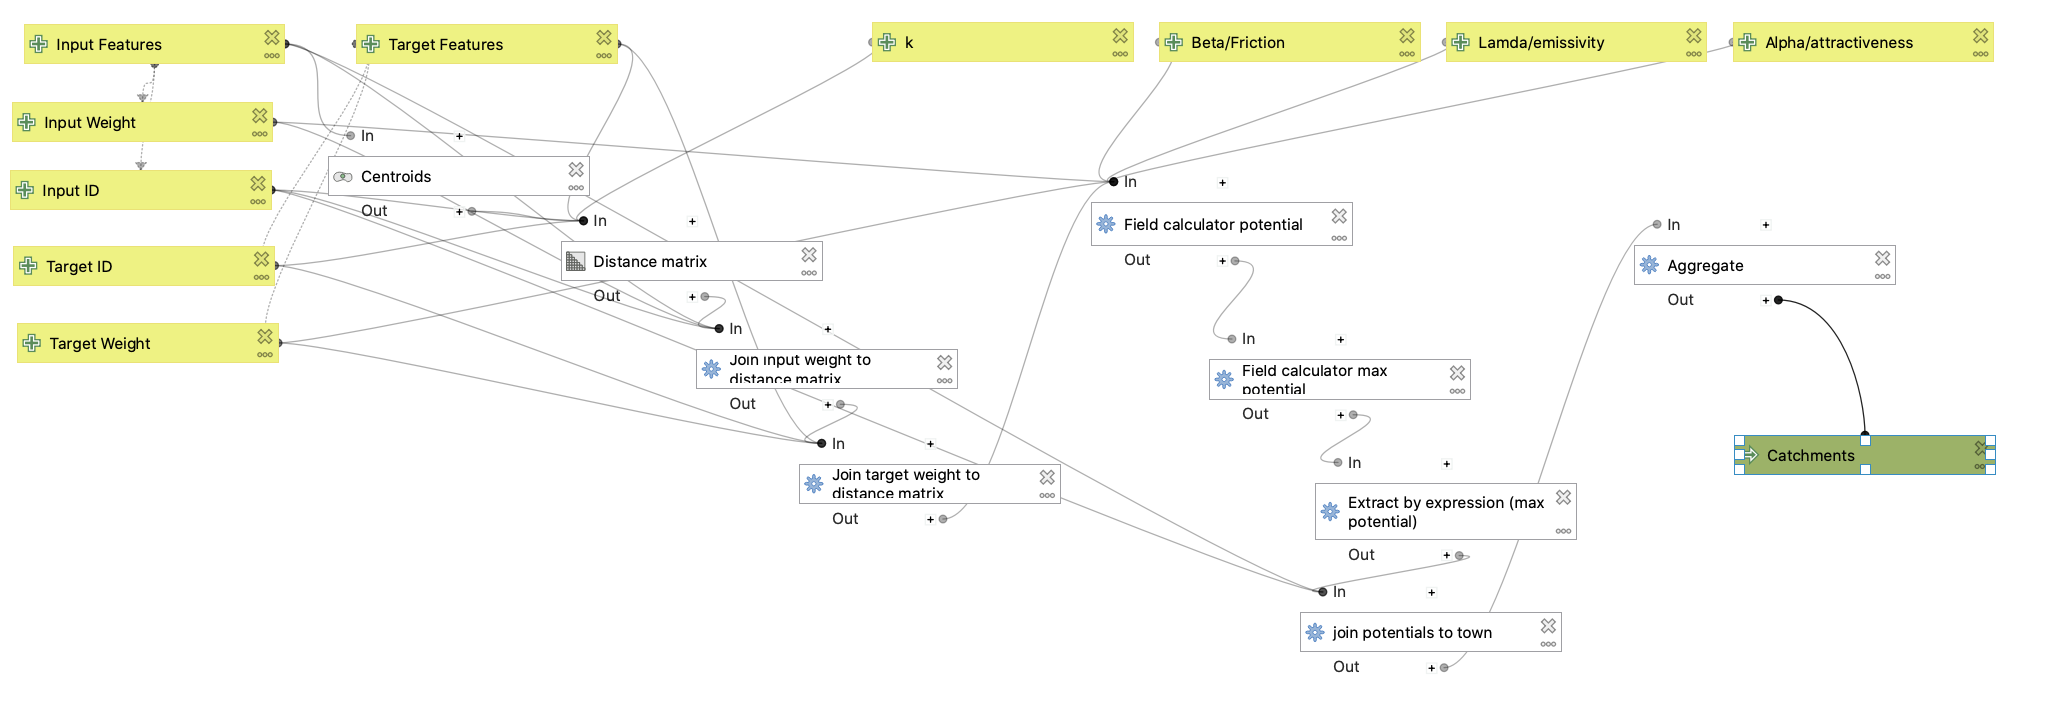 Figure 2. The Gravity Model.
This model accepts an input layer, target destinations, and a distance value, and was then used to combine a linear distance matrix and population data to determine hospital service areas, or HSAs, for the states of New England (this study also includes New York, Pennsylvania, and New Jersey). The final product may be found here, where these HSA catchment areas are then compared to those used by the Dartmouth Health Atlas. A static version of the map may be found below in Figure 3.
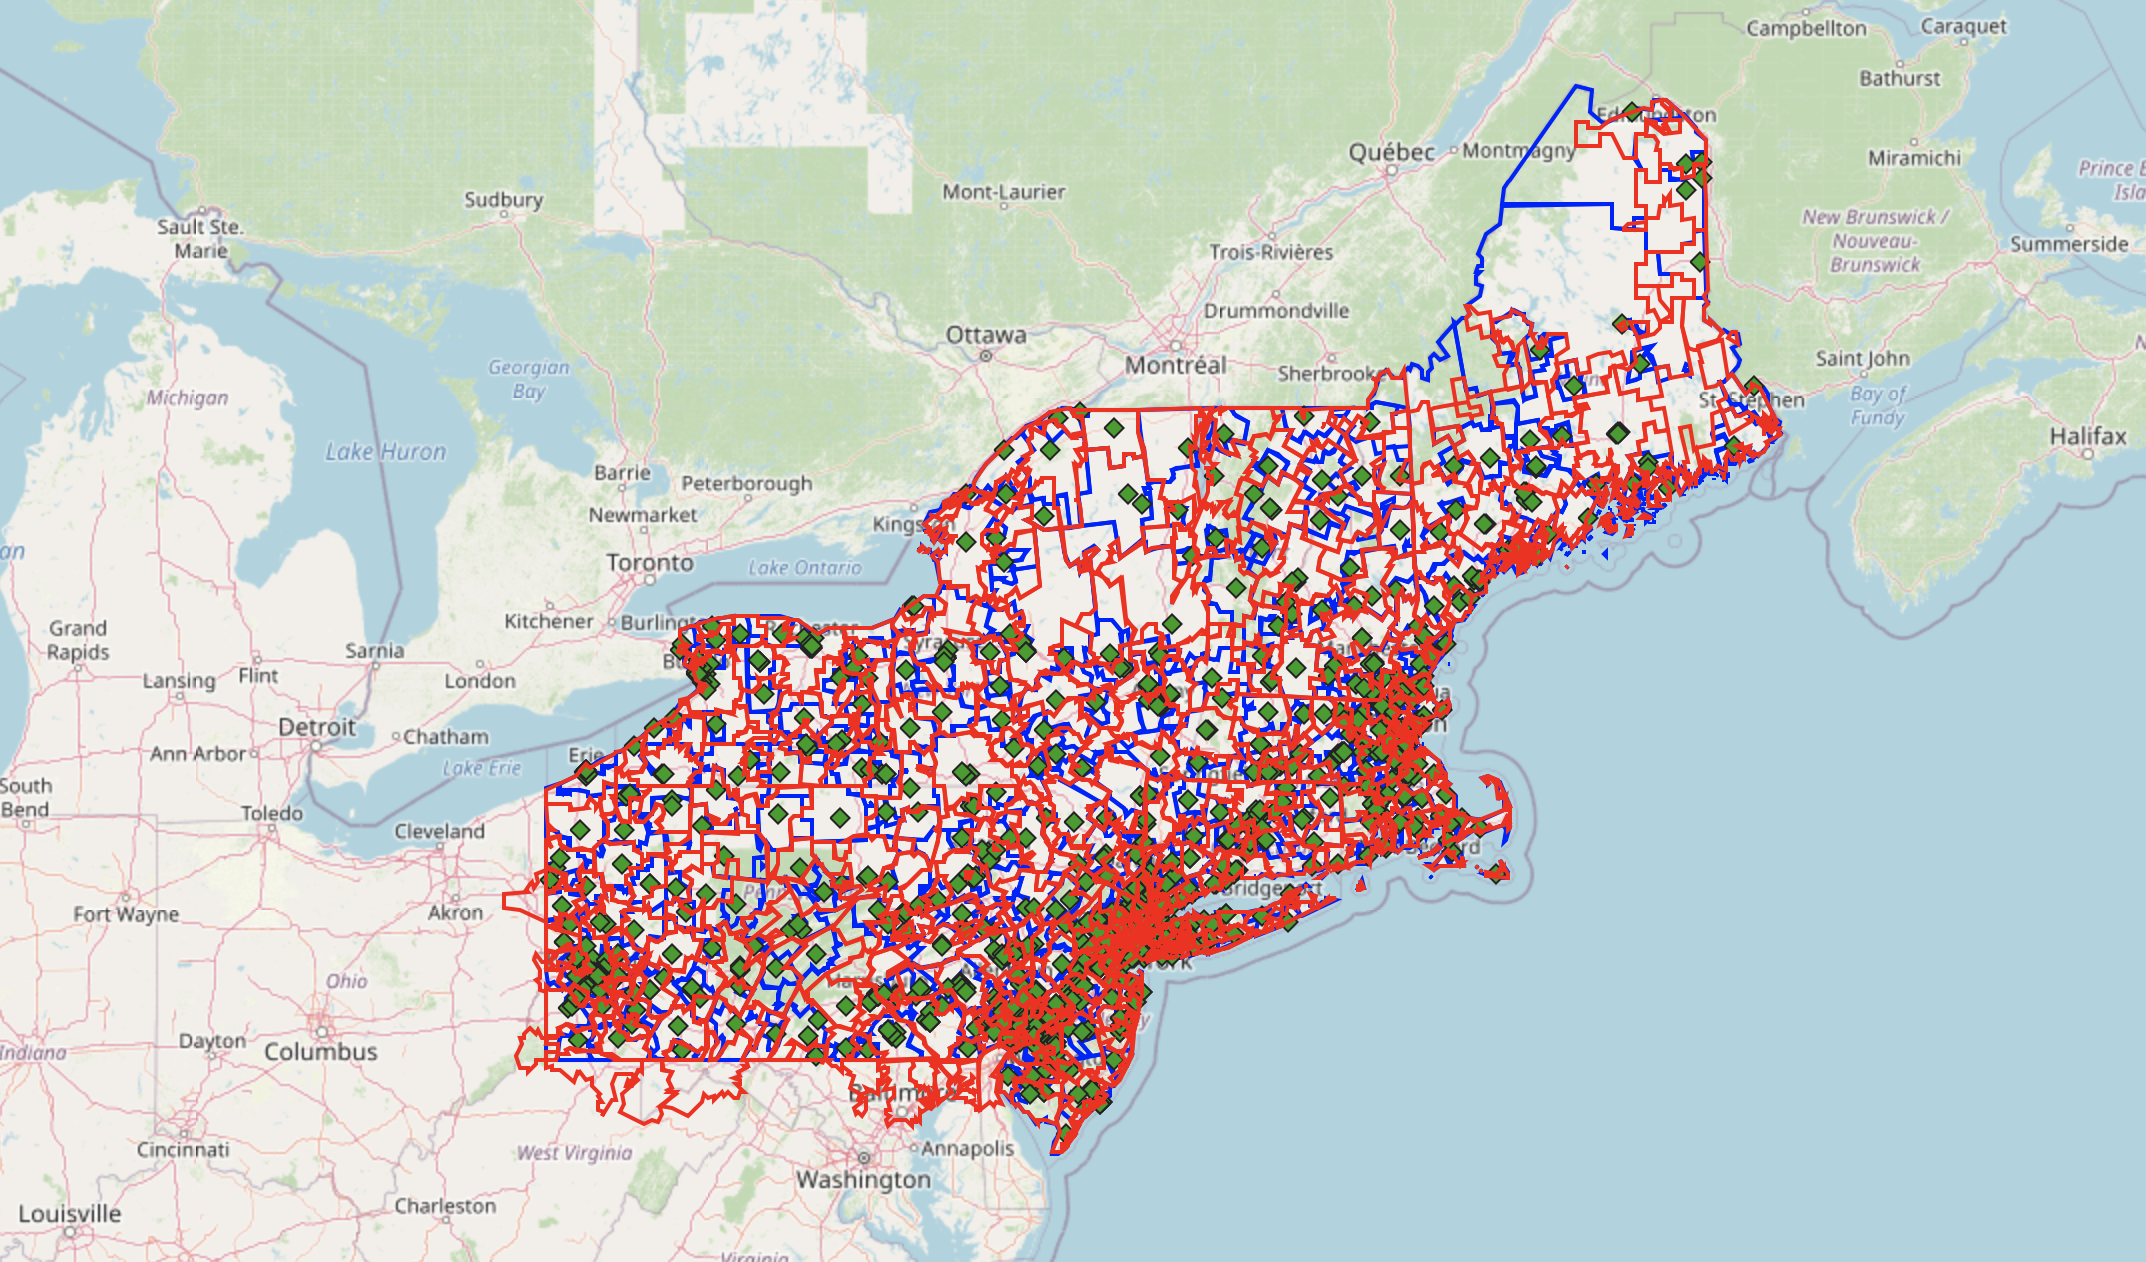 Figure 3. A comparison of catchment areas created by this gravity model and those used by the Dartmouth Atlas of Health Care.
As seen in the map, the blue and red lines (representing the boundaries for these catchment areas and Dartmouth’s catchment areas, respectively) do not match in many places. This could be due to a variety of reasons, most likely pertaining to the fact that this gravity model did not use a network distance matrix, and also did not account for physical geographic features such as bodies of water or mountains. This means the HSAs calculated by my model is significantly less precise.
Unexpected Challenges
I encountered many challenges in connecting the output of the distance matrix algorithm to the aggregate function outputting the product of the input and target weights, as well as experiencing some smaller technical issues in QGIS setting automatic “maximum” default values for λ, α, and β parameters. In addition, some unexpected challenges appeared while creating my Leaflet map, some of which are outstanding: the .html code failed to render a title on my map, and no abstract appears in the final version.
Acknowledgements
This project was certainly the most difficult of the semester, and I have many peers to thank for their help in guiding me to its completion. Thank you Hannah Rigdon for help in completing my Leaflet map, and thank you Emma Brown and Brooke Laird for help in completing the gravity model and preprocessing model. Thank you very much to Professor Joe Holler for providing data sources and guiding me through the technical and formatting logistics of this project. Thank you to all of my other my class peers in Spring 2021 GEOG 323 for assistance, conversations, and thoughts while deliberating this assignment.